

What you’ll accomplish
You will filter a Queue report, compare branches or operational dimensions, and export summary or ticket-level CSV files.Prerequisites
queue.reportpermission.- A selected Queue Unit and date range.
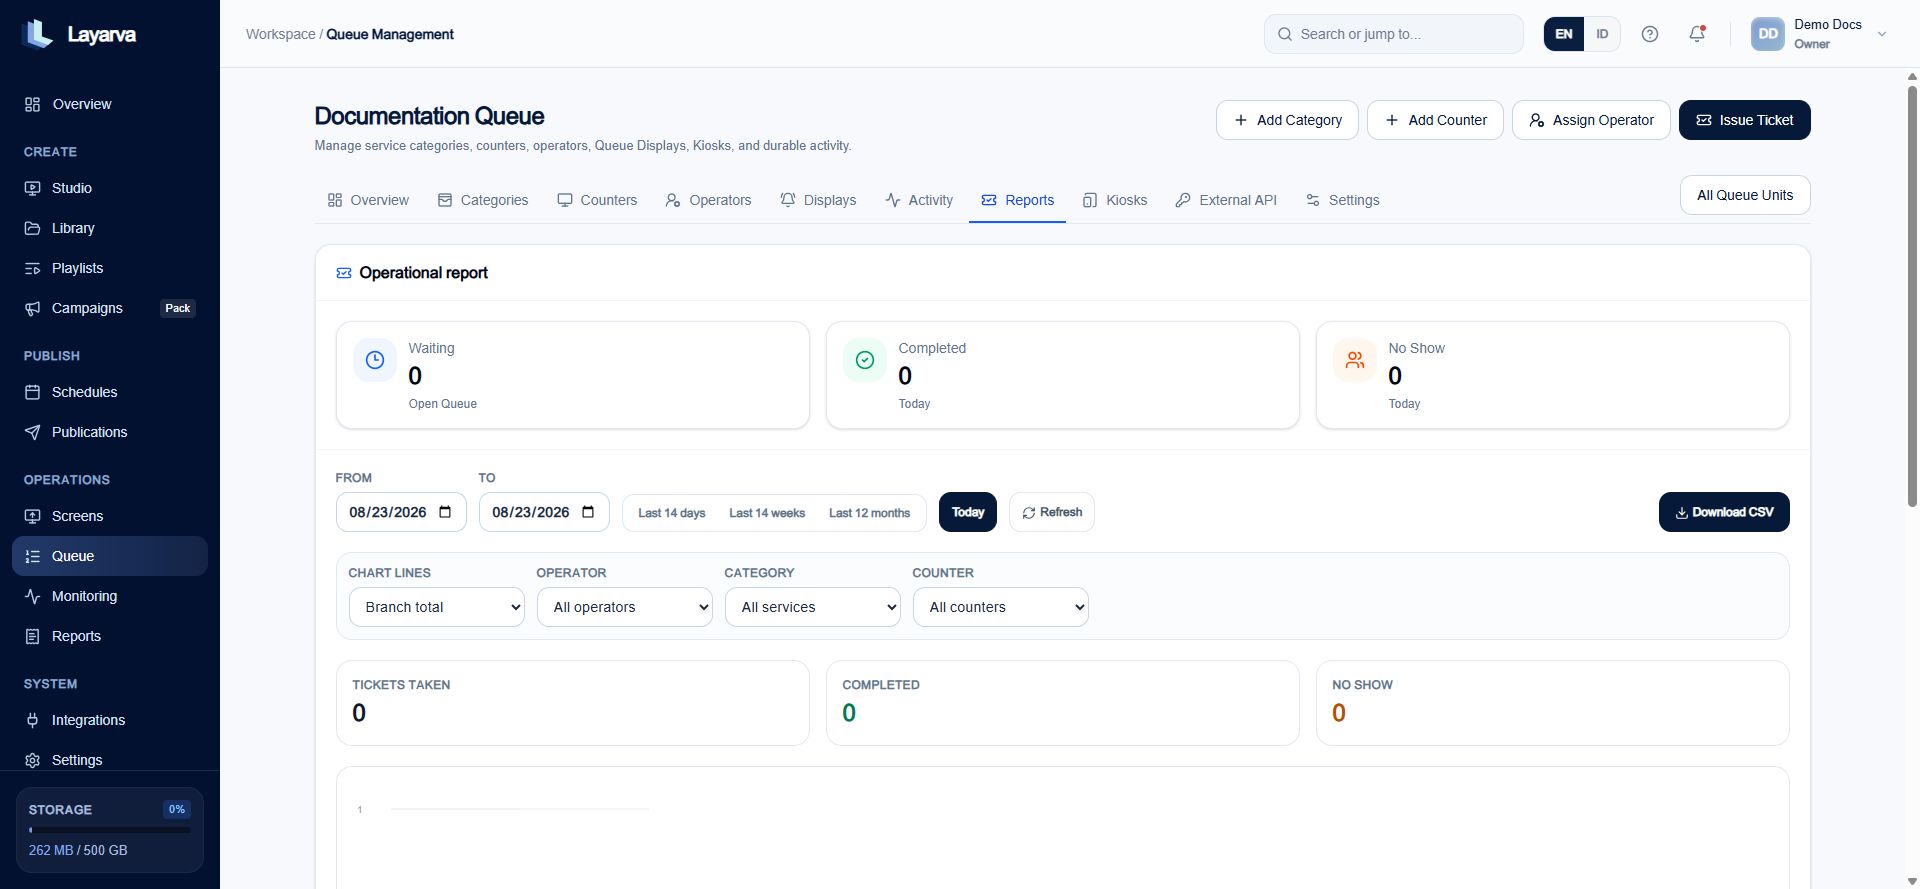
Queue Reports filter by date, Operator, Category, and Counter, with summary and detail CSV exports.
Report dimensions
- Tickets taken, completed, and marked no-show.
- Waiting and serving counts.
- Wait duration and service duration.
- Results by Operator.
- Results by service Category.
- Results by Counter.
Run a report
- Open the Queue Unit and select Reports.
- Choose a preset range or enter From and To dates.
- Select branch total, Operator, service, or Counter chart lines.
- Apply the relevant filters.
- Review summary cards and the trend chart.
- Export Summary CSV for aggregates or Detail CSV for ticket evidence.